
Complete Guide to Crypto Technical Analysis
Crypto technical analysis studies price and volume through candlesticks, trends, support and resistance, and indicators to help judge where to buy, where to sell and where the risk sits. It works best alongside position management.
Technical analysis does not guarantee accurate predictions, but it helps traders base decisions on observable structure instead of pure emotion. This guide goes from the basics to a practical framework and explains how to learn and how to use crypto technical analysis.
What Is Crypto Technical Analysis
Technical analysis assumes market behavior is reflected in price, and it studies:
Price action (candlesticks and trend structure)
Changes in volume
Support and resistance
Trend direction and strength
Indicator and pattern signals
Unlike fundamental analysis, technical analysis focuses more on what price is doing right now than on a project's long-term value. The two can be combined, but they are different tools.
The Three Core Premises of Technical Analysis
Price reflects information: known information shows up in price through buy and sell orders
Markets trend and carry momentum: price often moves in one direction for a period of time
History repeats in similar ways: structures and behavior patterns can recur, though never identically
Remember: similar does not mean it will necessarily repeat.
Start With Candlesticks and Trends
Candlestick A single candlestick usually contains the open, close, high and low, reflecting the battle between buyers and sellers over a period of time.
Trend structure
Uptrend: higher highs and higher lows
Downtrend: lower highs and lower lows
Ranging market: highs and lows alternate with no clear direction
Before trading, decide first: is this a trending market or a ranging market? Your strategy must match the market state.
Support and Resistance: The Most Practical Basic Tools
Support: an area where buying interest may appear as price falls
Resistance: an area where selling pressure may appear as price rises
Common sources:
Previous highs and lows
Upper and lower edges of consolidation ranges
Round numbers
Around moving averages
High-volume areas
When price approaches these levels, it is better to watch the reaction than to chase price blindly.
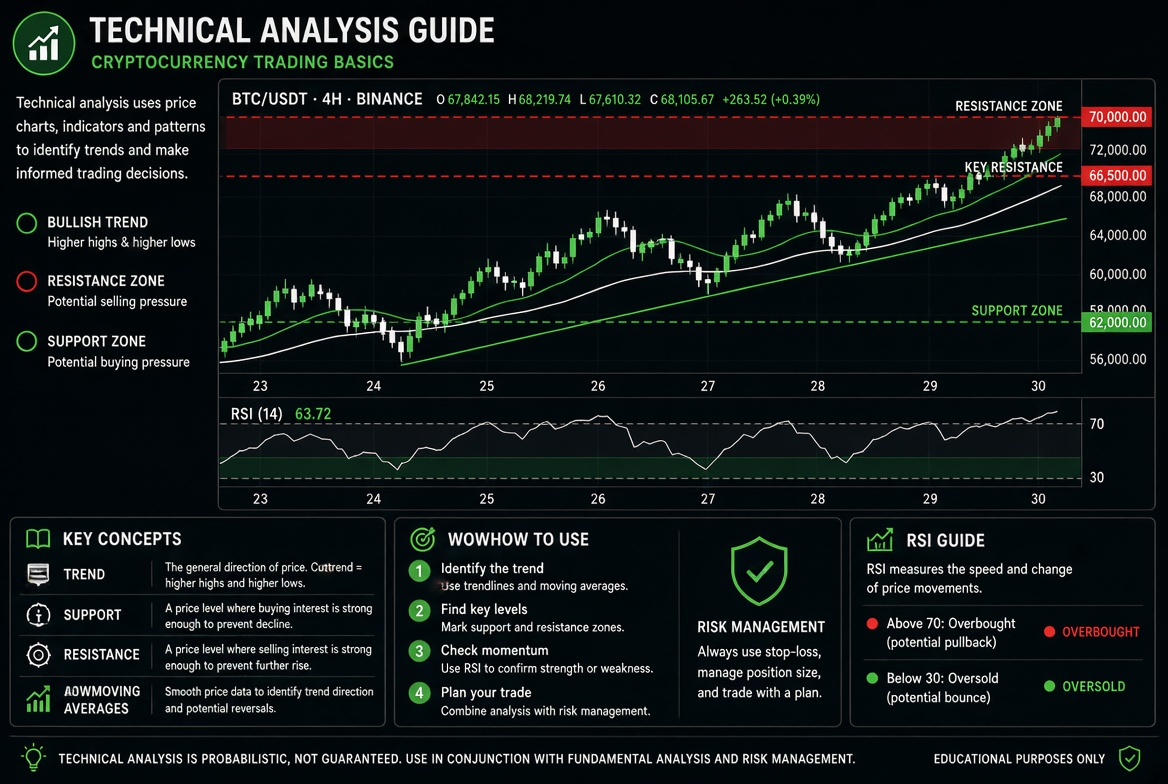
Understanding Common Technical Indicators
Indicators are mathematical expressions of price and volume. Use them for confirmation, not as your only basis.
Moving averages (MA/EMA) help identify trend direction and dynamic support and resistance. When a short moving average sits above a long one, the structure is often seen as bullish; the opposite is bearish.
RSI (Relative Strength Index) measures overbought and oversold conditions and momentum. A high reading does not mean price will fall immediately, and a low reading does not mean it will rise immediately; it works better combined with structure.
MACD tracks momentum changes and crossover signals, and is useful for confirming whether a trend is continuing or weakening.
Volume verifies whether a breakout has strength. A breakout without volume is usually less reliable.
Bollinger Bands show volatility expansion and contraction, useful for judging changes in the volatility regime.
The principle is: indicators serve price structure, not the other way around.
Common Chart Patterns
Continuation patterns: flags, triangle consolidations, rectangle consolidations. Reversal patterns: double top, double bottom, head and shoulders top or bottom.
The value of a pattern is that it provides context. Actual trading still requires confirmation, such as a pullback after a breakout or a strong-volume close.
How to Choose Timeframes
Daily: sets the big-picture direction
4-hour: finds medium-term structure
1-hour / 15-minute: refines entries
A common approach is to combine multiple timeframes:
Use higher timeframes for trend and lower timeframes for location.
Avoid going heavily long simply because a lower timeframe bounces briefly while the higher timeframe is falling.
An Actionable Technical Analysis Framework
Judge the higher-timeframe trend
Mark key support and resistance
Wait for price to reach a key zone
Confirm with candlestick behavior or an indicator
Predefine your stop-loss and target
Enter according to position-sizing rules
Review the outcome and improve execution
Without a framework, technical analysis easily becomes "obvious in hindsight, pure feeling in the moment".
What Is Different in Crypto Markets
24/7 trading: there is no market open or close as in traditional stocks, so moves can happen at any time
Strong sentiment drivers: narratives, news and funding rates amplify volatility
More false breakouts: especially in altcoins and during low-liquidity hours
High leverage distorts decisions: even a good technical signal can fail if the position is too large
Technical analysis solves reading the chart; risk management solves staying alive.
The Limits of Technical Analysis
It cannot guarantee predictions about the future
The same pattern has different success rates in different market conditions
Too many indicators create conflicting signals
Looking great in backtests but hard to execute live is a common problem
Technical analysis is a probability tool, not a precise prophecy.
Risk Notice
Crypto trading is extremely risky, and technical analysis cannot remove the possibility of loss. No indicator, pattern or strategy example here constitutes investment advice. Assess your own risk tolerance, manage position size strictly, and use only funds you can afford to lose.
FAQ
Q1: Should beginners learn indicators or candlestick structure first? A: Learn price structure, trends, support and resistance first, then indicators. Indicators support the analysis; they are not the starting point.
Q2: Does technical analysis work the same for Bitcoin and altcoins? A: The principles are similar, but altcoins have worse liquidity and more false signals, so risk control must be stricter.
Q3: Do I need to watch many indicators at once? A: No. Two or three complementary tools are usually enough; too many indicators tend to contradict each other.
Q4: Can technical analysis be used on its own? A: It can, but it works better together with position management, a trading plan, and the fundamental or macro context where relevant.
Q5: How long does it take to get comfortable with technical analysis? A: The basic concepts can be grasped quickly, but consistent execution takes ongoing practice and review. Discipline matters more than learning more.
Inirerekumendang pagbabasa
Tingnan ang higit pa