
Multi-Indicator Strategy: Trading with Signal Confluence
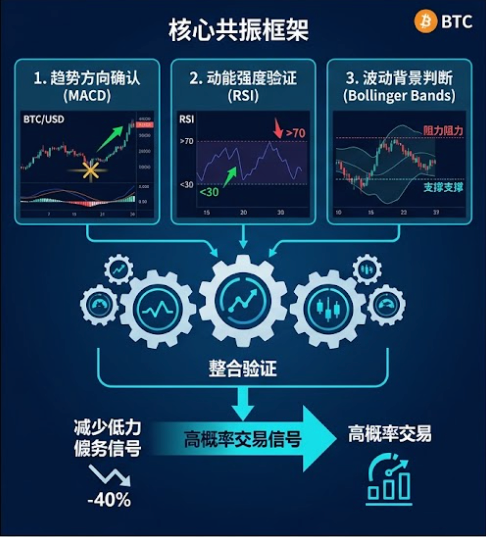
A multi-indicator confluence strategy combines trend, momentum, and volatility indicators into a multidimensional signal-validation system. This approach can reduce false signals from any single indicator by about 40%, improving the accuracy and consistency of trading decisions. The limitations of individual indicators are especially apparent in the volatile crypto market: trend indicators lag, momentum indicators often remain overbought during strong trends, and volatility indicators provide no directional bias. When several indicators simultaneously point in the same direction, information from different market dimensions cross-validates the setup and substantially strengthens the signal.
Why Use Multi-Indicator Confluence?
Every technical indicator has strengths and blind spots. Trend indicators such as moving averages and MACD are effective at identifying direction, but frequent crossovers can produce many false signals in ranging markets. Momentum indicators such as RSI and KDJ can identify overbought or oversold conditions and fading momentum, but may remain at extremes for extended periods during a strong one-way trend without triggering a reversal. Volatility indicators such as Bollinger Bands show how active price movement is, but do not indicate whether the next breakout will be upward or downward.
When signals across all three dimensions point in the same direction, trend direction, momentum strength, and the volatility environment are effectively required to agree. This layered filtering mechanism helps eliminate false signals generated by a single type of market noise.
Core Confluence Framework: MACD + RSI + Bollinger Bands
This is one of the most widely used and complementary three-indicator combinations in crypto trading.
The Role of Each Indicator
MACD confirms trend direction. When the MACD line crosses above the signal line to form a bullish crossover, bullish momentum may be starting. A bearish crossover suggests that bearish momentum is strengthening. MACD acts as the combination's directional guide.
RSI validates momentum strength. When RSI enters overbought territory above 70 or oversold territory below 30, the current move may be approaching an extreme. An RSI divergence is generally a more reliable warning than an overbought or oversold reading alone. RSI serves as the momentum referee.
Bollinger Bands provide volatility context. If price touches the upper band while RSI is overbought and the MACD histogram is contracting, the setup combines extreme volatility positioning, fading momentum, and weakening trend strength. Bollinger Bands supply the positional context.
Example Confluence Buy Signal
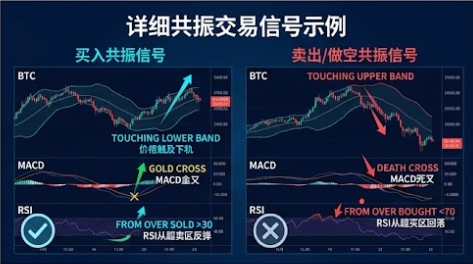
A higher-probability confluence buy signal forms when all of the following conditions are met:
- MACD: A bullish crossover forms and the histogram begins moving from negative to positive.
- RSI: It rebounds upward from oversold territory below 30 or holds above 50.
- Bollinger Bands: Price begins recovering after touching the lower band or finds support near it.
Example Confluence Sell Signal
The following combined conditions may indicate a higher-probability sell or short opportunity:
- MACD: A bearish crossover forms and the histogram begins moving from positive to negative.
- RSI: It enters overbought territory above 70 and begins to fall.
- Bollinger Bands: Price touches the upper band and then forms a reversal candlestick pattern.
Advanced Combination: KDJ and Bollinger Bands for Short-Term Trading
For short-term traders, KDJ combined with Bollinger Bands can be especially practical. KDJ responds quickly and can capture subtle changes in price momentum, while Bollinger Bands identify volatility extremes.
Example short-term long signals:
- Price touches the lower Bollinger Band.
- KDJ forms a bullish crossover in oversold territory, with K below 20.
- Rising volume confirms the move.
Example short-term short signals:
- Price touches the upper Bollinger Band.
- KDJ forms a bearish crossover in overbought territory, with K above 80.
- Rising volume confirms the move.
Volume: The Fourth Dimension of Signal Confirmation
Regardless of the indicator combination, volume confirmation is an essential fourth dimension. A complete confluence signal should include volume validation:
- High-volume breakout: Expanding volume as price breaks resistance is a key characteristic of a genuine breakout.
- Low-volume divergence: Price reaches a new high while volume contracts, warning that momentum may be weakening.
- High-volume reversal: A high-volume rebound from oversold territory is generally more reliable than a low-volume rebound.
Two-Indicator Confirmation vs Three-Indicator Confluence: Which Should You Choose?
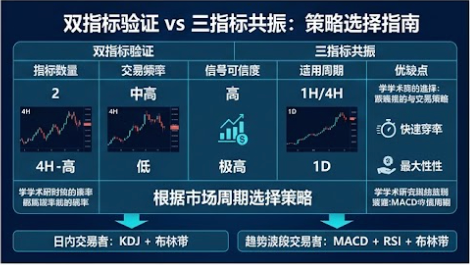
More layers of signal confirmation are not always better. Academic research using backtests of crypto market data from 2021 to 2026 found that two-indicator confirmation strategies often outperform single indicators in win rate and risk-reward ratio. However, three-indicator confluence can filter out too many profitable opportunities, resulting in fewer trades and delayed entries. Strict triple confirmation may reduce maximum drawdown, but can also weaken profitability.
Practical suggestions:
- Daily timeframe: Consider three-indicator confluence, such as MACD + RSI + Bollinger Bands, to filter short-term noise.
- Four-hour or one-hour trading: Consider two-indicator confirmation, such as KDJ + Bollinger Bands, to avoid overly scarce signals.
Limitations and Considerations of Multi-Indicator Confluence
Indicator overlap: MACD is calculated from moving averages, while KDJ also contains moving-average logic, so the two indicators partly share the same underlying information. True multidimensional confirmation should combine different indicator categories—trend indicators such as MACD or moving averages, momentum indicators such as RSI or KDJ, and volatility indicators such as Bollinger Bands—instead of stacking similar tools.
Failure risk in strong trends: Even when several signals align, a powerful one-way move can invalidate every technical signal. The core of trend following is to cut losses and let profits run, not to pursue 100% signal accuracy.
Empirical basis: Academic research indicates that crypto markets exhibit relatively strong price persistence, providing statistical support for trend- and momentum-based trading strategies. However, market regime—trending versus ranging—has a major effect on performance, so strategy parameters should be adjusted to market conditions.
Frequently Asked Questions (FAQ)
Q1: What is multi-indicator confluence, and why is it more reliable than a single indicator?
Multi-indicator confluence means that two or more different types of technical indicators produce trade signals in the same direction. It can be more reliable because each indicator analyzes the market from a different dimension—trend direction, momentum strength, or volatility context. When these dimensions agree, the probability of a false signal falls. Empirical data indicates that multi-indicator confluence can reduce false signals by about 40%.
Q2: Which indicator combination is best for beginners?
Beginners can start with MACD + RSI. MACD identifies trend direction, while RSI validates momentum strength. The indicators complement each other and provide relatively clear signals, making them a practical introduction to multi-indicator analysis. After gaining experience, traders can add Bollinger Bands to create a three-part confluence framework.
Q3: Should I enter immediately after a confluence signal appears?
Not necessarily. A confluence signal identifies a higher-probability opportunity zone, not an instruction to act immediately. Consider support and resistance levels and candlestick patterns such as engulfing patterns or hammer candles to refine the entry. Always set a stop loss because the market can still move in the opposite direction even when several signals agree.
Q4: How can I avoid analysis paralysis caused by too many indicators?
Limit the system to three indicators. Select one trend indicator such as MACD or a moving average, one momentum indicator such as RSI or KDJ, and one volatility indicator such as Bollinger Bands. These three categories provide sufficient complementary information. Additional indicators may create conflicting signals and interfere with decision-making.
Related tutorials:
- Beginner's Guide to Crypto Technical Analysis: From Candlesticks to a Trading System
- MACD Explained: Trend Following and Divergence Signals
- RSI Guide: Trading Overbought and Oversold Conditions
- Bollinger Bands Strategy: Trading Volatility
- KDJ Stochastic Indicator: A Tool for Short-Term Trading
- Moving Averages Explained: Using MA and EMA to Identify Trends
- Volume Analysis: Reading Price-Volume Relationships
Recommended reading:
Recommended
View more