
Quantitative Trading for Beginners: Backtesting Systems and Strategy Optimization
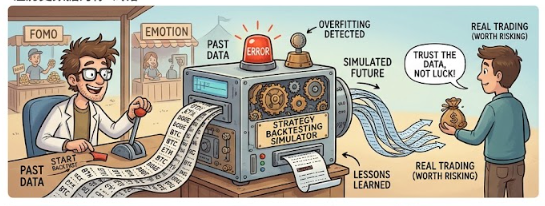
Quantitative trading replaces subjective judgment with mathematical models and statistical methods, using computer technology to define and execute trading strategies. Backtesting is its lifeline: it uses historical data to test whether a strategy actually works instead of leaving decisions to intuition or luck. The real value of quantitative trading is that it repeatedly tests a strategy's logic against history and measures profitability and risk with objective metrics, so emotional decisions do not turn into avoidable losses. In a crypto market that trades 24 hours a day and swings violently, a strategy that has been rigorously backtested and optimized is far more reliable than a judgement call made on the spot.
What Backtesting Really Is: Letting History Do the Trial and Error
The core job of a backtest is to simulate a strategy's buy and sell decisions on historical market data and calculate how much money it would have made, how much it would have lost, and how deep its maximum drawdown would have been under realistic conditions. It answers the most important question in trading: before committing real money, does the data support trusting this strategy at all?
A standard backtesting system usually includes the following modules:
Data module: fetch historical OHLCV data (open, high, low, close, volume) through exchange APIs or the CCXT library, with support for multiple timeframes from one minute up to daily bars.
Strategy module: define the actual buy and sell signal logic, such as moving-average crossovers, RSI overbought and oversold readings, or Bollinger Band breakouts.
Engine module: replay historical data bar by bar, simulate entries, exits, take-profit and stop-loss orders, and record the profit or loss of every trade.
Analytics module: calculate key metrics such as total return, maximum drawdown, Sharpe ratio, win rate and profit factor.
Take a dual moving-average crossover strategy as an example. The core logic of the backtest engine looks like this:
def backtest(data, ema_fast=20, ema_slow=50):
"""A simple moving-average crossover backtest example"""
df = data.copy()
df['ema_fast'] = EMA(df['close'], ema_fast)
df['ema_slow'] = EMA(df['close'], ema_slow)
position = None
trades = []
for i in range(1, len(df)):
# Golden cross: the fast EMA crosses above the slow EMA, so buy
if (df['ema_fast'][i-1] <= df['ema_slow'][i-1] and
df['ema_fast'][i] > df['ema_slow'][i] and position is None):
position = df['close'][i]
# Death cross: the fast EMA crosses below the slow EMA, so sell
elif (df['ema_fast'][i-1] >= df['ema_slow'][i-1] and
df['ema_fast'][i] < df['ema_slow'][i] and position is not None):
trades.append({'buy': position, 'sell': df['close'][i], 'pnl': df['close'][i] - position})
position = None
return trades
Strategy Optimization: Balancing a Good Strategy Against Overfitting
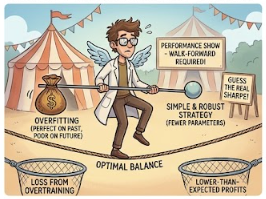
Strategy optimization means tuning parameters inside a backtesting framework, such as moving-average periods or RSI thresholds, to find the combination that performs best on historical data. The central challenge is that overfitting makes a strategy look flawless in the past while it keeps losing money in live trading.
One study based on a linear prediction model shows that when a strategy is backtested on ten years of data, its out-of-sample Sharpe ratio is only about 30% of its in-sample Sharpe ratio. The more parameters a strategy has and the more complex it becomes, the higher the overfitting risk. Another study of three classic strategies, RSI, MACD and Bollinger Bands, used rolling backtests and found that a multi-dimensional objective, one that weighs return, consistency and downside risk together, improved out-of-sample performance more than simply chasing historical return.
Core Optimization Principles
Fewer parameters is better: strategy complexity correlates directly with overfitting risk. A simple strategy such as a dual moving-average crossover overfits less easily than a complex multi-parameter model.
Be cautious with low-Sharpe strategies: a low-Sharpe strategy is more sensitive to the luck of parameter selection, so a good backtest may be nothing more than coincidence; when a strategy's true Sharpe ratio is high enough, overfitting risk falls sharply.
Longer backtests are better: a long history covers more market environments and reduces the chance that one particular regime drives the result.
Optimization Methods: From Manual to Automated
Adjusting parameters by hand is the most basic form of optimization. More advanced methods include:
Grid search: iterate through parameter combinations, for example testing every integer EMA period from 10 to 50 and keeping the best-performing set.
Random search: sample randomly from the parameter space, which suits strategies with a large number of parameters.
Genetic algorithms: mimic natural selection so that parameter sets keep evolving; this is one of the mainstream approaches to optimizing complex strategies.
Advanced Topic 1: Using a Better Objective Function (GT-Score)
Conventional optimization usually aims to maximize total return or the Sharpe ratio. Recent research proposes a more robust objective: GT-Score, a composite objective function with the following mathematical form:
GT_Score = (μ · ln(z) · r²) / σ_d
where:
μ: the average return per trade
ln(z): a logarithmic transformation of statistical significance
r²: the consistency of the strategy's returns (similar to R²)
σ_d: the downside volatility of returns, which penalizes losses only
The core idea of GT-Score is to optimize return, consistency and downside risk at the same time instead of chasing high return alone. Research shows that strategies optimized against GT-Score are more robust out of sample than strategies that simply maximize total return or the Sharpe ratio, especially when market style shifts.
Advanced Topic 2: Out-of-Sample Validation, Separating Luck from Skill
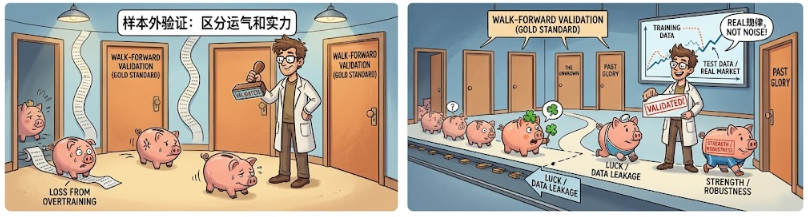
Out-of-sample validation is the most neglected yet most important step in quantitative trading. The logic is straightforward: test the strategy on fresh data that was never touched during optimization. If it still performs steadily out of sample, the strategy has found a real market regularity rather than merely memorizing the noise in historical data.
Common out-of-sample validation methods include:
Walk-Forward Validation: widely regarded as the gold standard of strategy validation. Parameters are optimized on one stretch of history, say four years, then tested on the next stretch, say two years, and the window keeps rolling forward. At every new test window the strategy has to prove itself again in a market environment it has never seen. The advantage is that it mirrors real trading: you can never use future data to optimize today's strategy.
Train/test split: the simplest method. Divide all historical data by a ratio such as 7:3 into a training set, used to optimize parameters, and a test set, used for final validation, usually with an embargo period between the two to prevent data leakage.
Monte Carlo analysis: simulate many different market paths through repeated random sampling to test how stable the strategy's performance really is.
Common Python Backtesting Frameworks
These frameworks are a reasonable starting point:
Backtrader: one of the most classic Python backtesting frameworks, with a mature community and support for custom indicators and strategies.
VectorBT: a high-performance backtesting library built on vectorized computation that can test thousands of parameter combinations quickly, well suited to multi-asset crypto backtests.
Qubx: a newer-generation quantitative framework covering the whole process from backtesting to live deployment, built on Python 3.10+.
Open-source reference project: a complete quantitative system built on the Binance API, covering data collection, strategy backtesting (moving-average crossover, turtle strategy and more), a live trading engine and risk management.
Frequently Asked Questions (FAQ)
Q1: The backtest looks great, so why does live trading still lose money?
The main reasons are overfitting and data leakage. A strategy that backtests well may have memorized the noise in historical data during optimization instead of discovering a real market regularity, or the backtest may have ignored real trading costs such as fees and slippage. Walk-Forward Validation is the best way to check whether a strategy is genuinely robust.
Q2: How much historical data should a strategy be backtested on?
The longer the better, but market structure changes matter. A long history, ten years for example, covers bull and bear cycles and other market environments, which reduces the chance that one regime drives the result. Crypto markets have a short history, so cover at least two to three years and include clear trending and ranging phases.
Q3: Which metric should be used as the optimization objective?
Do not look only at total return or the Sharpe ratio. It is better to balance maximum drawdown, Sharpe ratio, win rate and profit factor at the same time. For more advanced work, use composite objective functions such as GT-Score, which weigh return, consistency and downside risk together.
Q4: What are the concrete steps of Walk-Forward Validation?
Divide the historical data into multiple rolling time windows, and split each window into a training set, four years for example, and a test set, two years for example. Optimize parameters on the training set, validate performance on the test set, then roll the window forward and repeat. The performance across several test windows shows whether the strategy keeps working.
Related tutorials:
Recommended reading:
Recommended
View more